Running the OpenShift console in plain Kubernetes
The OpenShift console offers a nice GUI intended for use within OpenShift clusters. It offers a consolidated overview of resources, integrated metrics, alerting and also allows you to update cluster resources from a web browser. As the name implies, the console is developed with OpenShift being the primary usecase. During my dayjob, I've grown to really like the OpenShift console for quick checks and visualization of resources, so I wanted to set it up for myself. The only problem: I run k3s at home due to resource constraints. So I set out on a journey to see if I can get the console running on plain Kubernetes.
Prerequisites
If you want to follow along on your own cluster, Authentication on your cluster needs to be set up properly. I am using OIDC, so this is what we'll set up here but feel free to experiment with other providers
Starting the console locally
Luckily, the developers of the console did a very good job in keeping the console separated from the rest of the OpenShift components and even provide a guide on how to develop the console locally against a plain Kubernetes cluster. So let's check out the code and see if it works.
The repository provides us with the following instructions:
./build.sh
source ./contrib/environment.sh
./bin/bridge
Provided your local kubeconfig file is set up correctly, this will start the
console on localhost:9000 without any errors. When clicking around however,
you'll notice that you're not logged in with your user, but
system:serviceaccount:kube-system:default. The reason for this can be found in
the contrib/environment.sh file. This script sets up authentication using the
first service account found in the kube-system namespace. This is obviously not
what we want. We want every user to log in as themselves so let's take a look at
the available authentication methods.
Authentication
At the time of writing, the console supports either the openshift or oidc user
authentication methods.
If you perform authentication on another layer (e.g. via a VPN gateway) you could
disable user auth alltogether and use the service-account or bearer-token method
to perform actions taken in the console using an existing service account. I
want each user to log in to the console directly, so I will set up user
authentication using the oidc strategy.
The console can be configured three ways: a configuration file, environment
variables or command line arguments. The values are also applied in this order, so command line arguments override anything else, which is why I'm using them to
debug the setup locally. Names of configurable parameters can be found by
running bin/bridge -h.
bin/bridge -k8s-auth oidc -user-auth oidc
#W0501 15:29:54.430483   37685 main.go:213] Flag inactivity-timeout is set to less then 300 seconds and will be ignored!
#W0501 15:29:54.430526   37685 main.go:347] cookies are not secure because base-address is not https!
#F0501 15:29:54.430541   37685 validate.go:50] Invalid flag: base-address, error: value is required
That didn't work. The program tells us about missing values so let's configure them according to our oidc provider
bin/bridge \
  -k8s-auth oidc -user-auth oidc \
  -user-auth-oidc-client-id=<client-id> \
  -user-auth-oidc-client-secret=<client-secret> \
  -user-auth-oidc-issuer-url=<issuer-url> \
  -base-address http://localhost:9000
These values can be taken from your api server configuration. If everything is set up correctly (don't forget the redirect URI in the OIDC provider), you will be authenticated and perform actions using your own user account.
Metrics
The OpenShift metrics stack is an entirely differnt component and performs the heavy lifting of monitoring workloads in a cluster. As with the console, it could be run in plain Kubernetes as well, but I already have a metrics stack set up using kube-prometheus. It is still possible to connect this to the console, but involves a bit more work.
The relevant configuration parameter for this is called
k8s-mode-off-cluster-thanos. If this is the first time you hear of
thanos, don't be afraid. It is a high availability and
long term storage solution for prometheus, but can be replaced by plain
prometheus for our purposes. If you have set up thanos already, more power to
you, but I did not yet have the time for this.
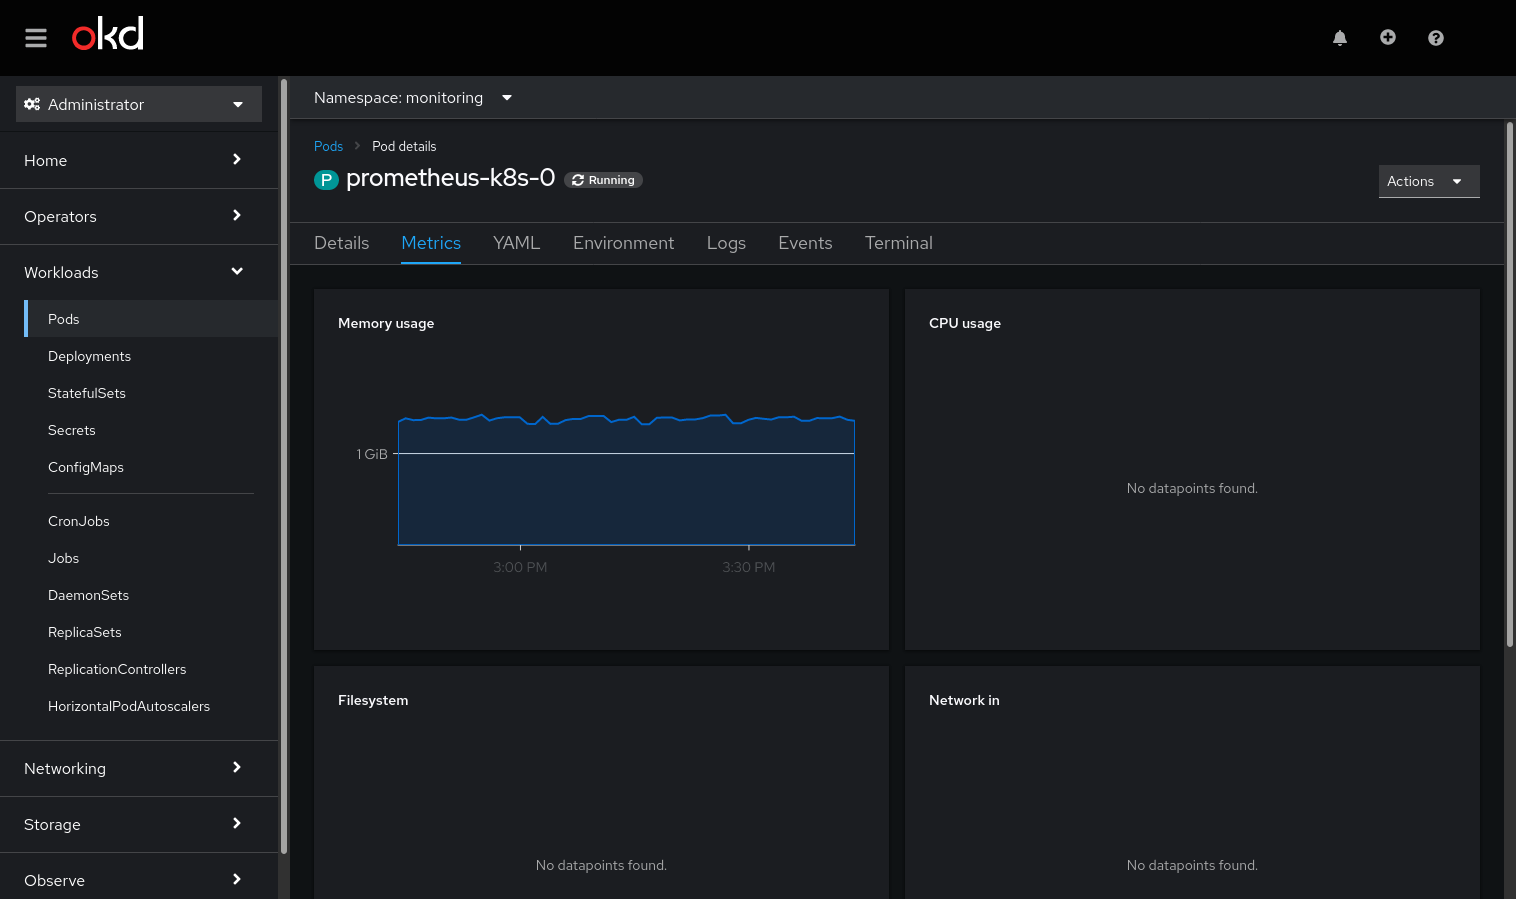
When supplying the console with the correct thanos/prometheus url, you will already see your first metrics:

One out of four! Not too bad. Let's see how we can retrieve these missing metrics. By clicking on the panel, we're directed to the metrics query. Here the problem becomes obvious.

This looks like a custom metric (a.k.a. recording rule) to me. But where do we
find the source for this, so we can reuse it in our monitoring stack? Sourcegraph
to the rescue! By using the query repo:openshift pod:container_cpu_usage:sum we
quickly find the source for these rules: prometheus-rule.yaml in the
cluster-monitoring-operator.
Placing these rules into your prometheus/thanos instance is left as an exercise to the reader.
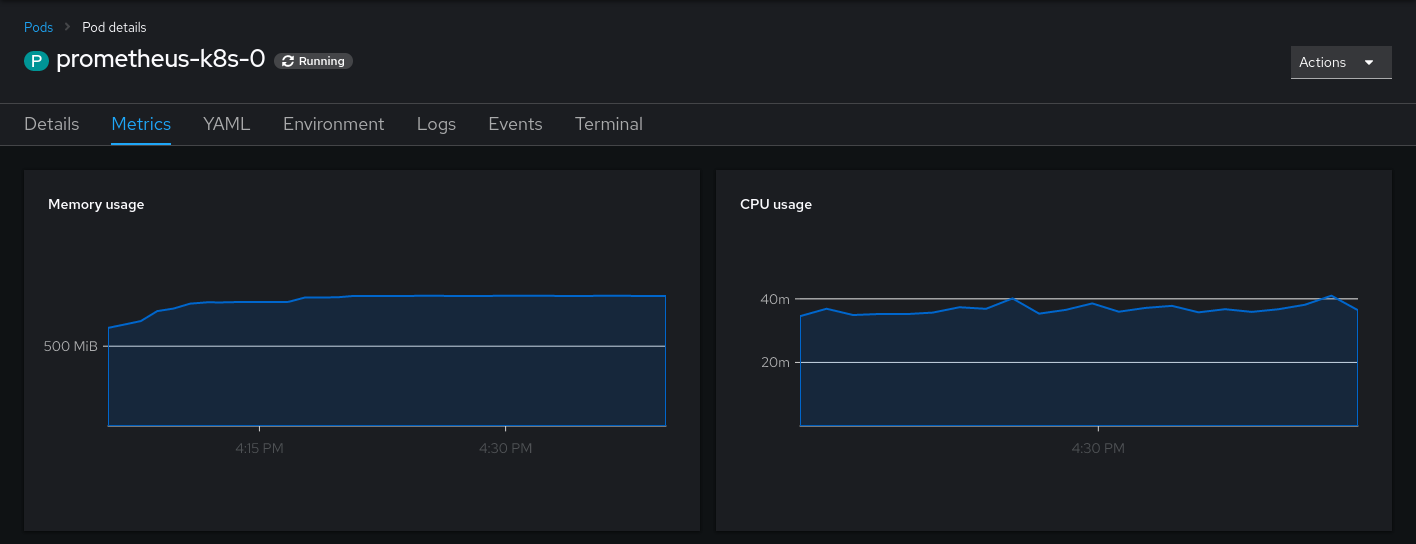
Afterwards, you will at least see the memory and CPU Usage. The other metrics in the console partly depend on openshift features and/or metrics under default names. They can be reconstructed using recording rules as well, but I am happy without them.

Dealing with state
While running the console, you might have noticed errors in the form of ~Failed
to get user data to handle user setting request: the server could not find the
requested resource~. This occurs when the console tries to save your user
settins in a config map. To store user settings, the console expects a
user.openshift.io resource to be present, which is only available in openshift
clusters. The easy workaround for this is to specify
-user-settings-location=localstorage, as this will skip this step. Maybe support
for clusters without this resource present will be contributed some time in the
future.
Deploying the console
Deploying the console is as easy as deploying any other application. Container
images are available from quay.io/openshift/origin-console. Sadly only amd64
images are available but if you need to use arm images, you can build the
console yourself.
I'll not go into detail here but simply refer to my configuration repo if you require inspiration on how to set it up on your cluster.
Note that iff you plan to run the console inside your cluster, you still need to
configure it to use the off-cluster Kubernetes mode. Otherwise it will use the
OpenShift default endpoints instead of your configured URLs.
Further Customization
Of course, the customization does not end here. Feel free to play around with other parameters of the bridge binary (especially the branding ones)! A multitude of further integrations are possible (alertmanager, grafana, developer perspective). I might post more about them as I get them working.